Thu 08 December 2016
The result
This will be more of a cookbook, with some rationale and explanations sprinkled in rather than a full on ground-up introduction to d3js (otherwise it would never get off the ground!).
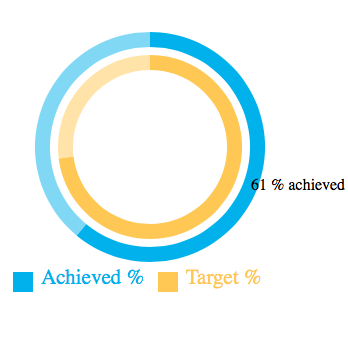
Here's one I prepared earlier, you can imagine it's like some sort of fitbit or other health app where you're aiming for some percentage or value and you have a target. In this it's a radial progress graph meaning the outside and inside rings shows the value between 0 and 100%, and the rest of the value to 100% is more faded if the value is less than 100%.

The recipe
Here's the HTML that holds the javascript.
<!DOCTYPE html>
<html>
<head>
    <meta content="text/html; charset=utf-8" http-equiv="Content-type">
    <title>Chart Test</title>
    <script src="https://d3js.org/d3.v4.min.js"></script>
    </script>
    <style type="text/css">
           svg {
             overflow: visible !important;
           }
    </style>
</head>
<body>
    <script type="text/javascript">
    ... (see below)
    </script>
</body>
</html>
First we setup our helper and variables
function rgba(rgb, a) {
  return "rgba(" + rgb[0] + "," + rgb[1] + "," + rgb[2] + "," + a + ")";
}
var data = [["Achieved", 61, 'blue'],["Target", 73, 'red']],
  w = 290, h = 290,
  ringWidth = 15, pad = 8, textBox = 20,
  radius = (Math.min(w, h) / 2) - textBox / 2.0;
  ringColours = [[0, 174, 239],[255, 202, 58]],
  svg = d3.select("body").append("svg").attr('width', w).attr('height', h).append(
      'g').attr('transform', 'translate(' + (w / 2) + ',' + (h / 2) + ')');
Now that we have a bare SVG element, let's start the graphing, by looping over our data to be graphed as rings and drawing them concentrically. (we'll cover the method definiton afterwards).
data.forEach(function (e, i) {
    makeCircle(e, i)
});
Now that the graph has been drawn we can put the legend in, we'll come back and explain how the circles works.
var legend = svg.selectAll('.legend').data(data).enter().append('g').attr(
  'class', 'legend').attr('transform', function (d, i) {
  return 'translate(' + (pad - w / 2 + i * w / 2) + ',' + (h / 2 - textBox) + ')';
});
legend.append('rect').attr('width', textBox).attr('height', textBox).style(
  'fill',
  function (d, i) {
      return rgba(ringColours[i], 1.0);
  }).style('stroke', d3.category20);
legend.append('text').attr('x', textBox + pad).attr('y', textBox - pad).style(
  'fill',
  function (d, i) {
      return rgba(ringColours[i], 1.0);
  }).attr('font-size', "1.3em").text(function (d, i) {
  return d[0] + " %";
});
Here's the function that can make concentric circles, it starts by calculating the outer radius out and providing the ringWidth. There's mouse-over information provided also.
function makeCircle(item, level) {
  rData = [{
      "on": true,
      "val": item[1]
  }, {
      "on": false,
      "val": 100 - item[1]
  }];
  var pie = d3.pie().sort(null).value(function (d) {
      return d.val;
  });
  var out = radius - (textBox / 2 + 10 + (level * (ringWidth + pad)))
  var arc = d3.arc().innerRadius(out - ringWidth).outerRadius(out);
  var g = svg.selectAll(".arc").data(pie(rData)).enter().append("g");
  g.append("path").attr("d", arc).style("fill", function (d) {
      return rgba(ringColours[level], d.data.on ? 1.0 : 0.5);
  }).on("mouseover", function () {
      d3.select(this.parentNode).select("text").style("display", "block");
  }).on("mouseout", function () {
      d3.select(this.parentNode).select("text").style("display", "none");
  });
  var text = g.append("text").attr("transform", function (d) {
      return "translate(" + arc.centroid(d) + ")";
  }).style("display", "none").attr("dy", ".35em").text(function (d, i) {
      return rData[i].val + " % " + (d.data.on ? "" : "not ") + "achieved";
  });
}
Unfortunately there's alot of chaining commands needed as is the javascript way. Hopefully this is a starting point for some awesome types of things that can be done with d3js.